August 16, 2021  Andy Hackbarth and Steve Hackbarth
Report: 2021 Database Benchmark for Healthcare Analytics

Ursa Health Blog
Visit Ursa Health's blog to gain healthcare data analytics insights or to get to know us a little better. Read more ...
New cloud-based database management systems (DBMSs) are powerful and scalable, but it’s hard to know which technology will best serve your organization’s needs under realistic data processing scenarios. This uncertainty is compounded in healthcare, where the characteristics of a typical data analytic exercise don’t usually conform to the “big data,” aggregation-oriented use cases around which the latest generation of columnar DBMSs were developed.
To help answer these questions, we tested the most popular DBMSs on the Amazon Web Services and Microsoft Azure cloud platforms—both the latest-generation columnar systems and traditional systems—using an ETL of Ursa Studio’s Core Data Model as the benchmark. The tests were performed in May and June 2021.
The results were dramatic and unexpected: not simply the databases that came out on top but the scale of that superiority, sometimes an order of magnitude or more for a comparable cost. The results of this benchmark have influenced our client engagements and are broadly relevant for anyone addressing the central challenges of processing healthcare data.
To download a copy of this report as a PDF, click the link below.
The benchmark
A foundational component of Ursa Studio, our healthcare data analytics platform, is its Core Data Model, a collection of 109 tables and views covering a broad set of healthcare concepts drawing from claims, billing, and clinical data. The benchmark times reported below represent the runtime of a full refresh of these tables.
The Core Data Model is hierarchical in that it includes tables for the basic building blocks of an analytic deliverable—what we call “natural objects,” such as pharmacy claims, health plan membership records, patients, and providers—as well as derived tables representing more interpreted, targeted concepts built from those natural objects. For example, in one hierarchical sequence, a table of professional claims is used to generate a table of clinician office visits, which is then used to generate a table of patient-periods of attribution to a particular primary care provider based on their history of office visits. The two upstream tables are themselves part of the data model and useful in their own right, but also serve as intermediate steps in the generation of the third, most complex table.
Ursa Studio executed the benchmark ETL. The platform keeps track of the hierarchical dependencies between tables as the ETL progresses, kicking off the refresh of a downstream table as soon as all required upstream tables finish. It also builds indexes, generates table statistics, and performs post-processing validation queries where appropriate. As a no-code development platform, Ursa Studio automatically generates the SQL code used throughout the benchmark, using the appropriate SQL dialect for each DBMS.
Lastly, the benchmark times reported below do not include time spent loading raw source or reference data into the database. While we’ve found some dramatically different load times from AWS S3 buckets compared with Azure storage containers and load tools from other systems, we consider these import features to be independent of the DBMSs and therefore outside the scope of what we were measuring.
Raw data
For these tests, we started with a raw dataset of synthetically generated claims data—medical and pharmacy claims, with membership periods—simulating roughly 60,000 commercial health plan members over 9 years. The data, though fictional, represent realistic patterns of membership and utilization, as well as realistic levels of data incompleteness and inconsistency. (The benchmark results include the time spent cleaning and transforming these raw data to flow into the structure of the Core Data Model’s natural object layer.)
We duplicated the original 60,000 members to generate cohorts of 200,000 and 2 million members for testing the performance of the benchmarked systems at a variety of scales. If a DBMS failed to perform sufficiently well on the 200,000 cohort, however, we didn’t attempt the 2-million-member run.
Query focus
Most of the queries executed over the course of the benchmark ETL perform what can be considered “data preparation,” involving a lot of joining, filtering, and reshaping of data tables, often while retaining a large number of columns on each table. As such, they do not represent the canonical use case around which the latest columnar database technologies were designed, namely the OLAP-oriented aggregation of a small number of columns over a large volume of records.
The emphasis of our benchmark on data preparation rather than data aggregation reflects our experience that the computational time spent on developing and executing data preparation tends to dwarf that spent on aggregating results over a clean and well-formed data mart, or fitting a machine learning model on a clean and well-labelled analytic file.
The outsized importance of data preparation might be especially true in healthcare, where record volumes tend to be relatively small compared to other industries but data preparation can be very demanding. Raw healthcare data is typically messy, diverse, and incomplete, with complex business or clinical logic required to accurately characterize, for example, a patient’s disease status or the purpose of a hospital admission.
In short, our benchmark provides a real-world test for these newer DBMSs—perhaps outside of their nominal comfort zone—that should be especially relevant to healthcare organizations.
DBMS configuration and optimization
Aside from setting the scale, we used out-of-the-box DBMS configurations. We did this to provide a fair comparison between technologies, and because it’s probably realistic to expect many organizations to use those default settings. In terms of table-level optimizations, we used only indexes, when available. Therefore, organizations can expect to obtain performance improvements should they take advantage of DBMS-specific optimization features.
That said, in the healthcare data preparation context—again, relatively small record counts with complicated query logic—most of the optimization features we’ve experimented with seem to yield only modest performance gains. In contrast, the performance problems that we encounter most in the wild occur when the optimizer becomes confused and produces an inefficient query plan. For example, a query that’s been running in under 2 minutes for months takes 45 minutes after the latest week of data are loaded because a critical sequence of joins and filtering was reordered in the plan.
We have found that the most effective and scalable defense to this class of problem is good general query hygiene: weeding out unnecessary complexity and redundancy, ordering logic to filter out as many records as possible before performing especially costly joins, and breaking complicated sequences into multiple steps and intermediate tables that can be indexed and analyzed, and so on. In this regard, the ETL populating our Core Data Model is heavily optimized, having been refined over dozens of development iterations.
The results
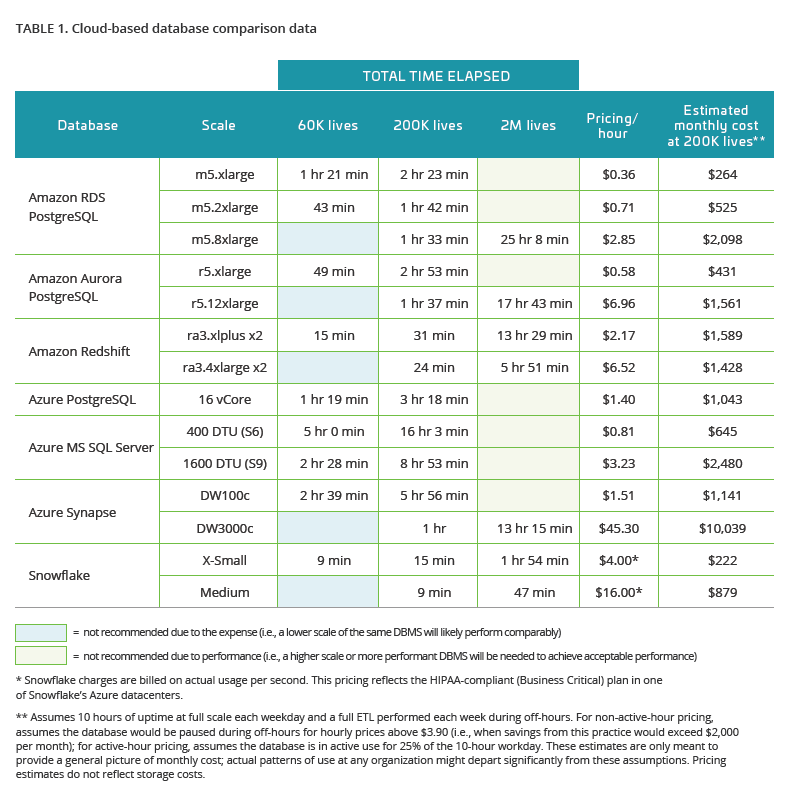
The table below shows the results of a full ETL run of Ursa Studio’s Core Data Model, using synthetically generated source data, against the out-of-the-box configurations of popular cloud-based databases.

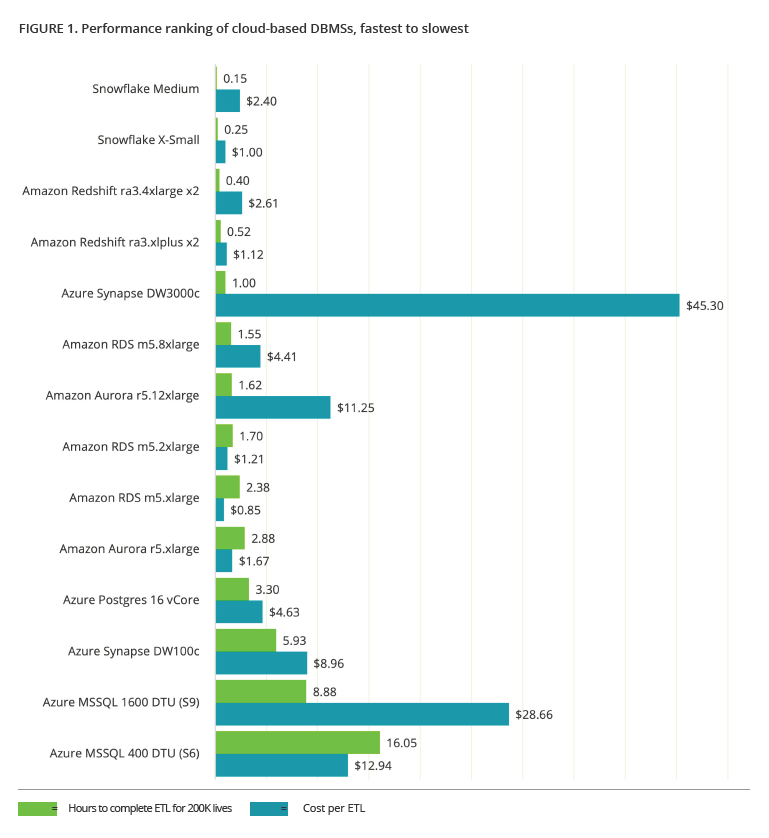
The following chart shows the DMBSs ranked by performance on the 200,000-member ETL (fastest at the top), with their cost per ETL.

Here are the most notable findings:
- Amazon beats Microsoft: Amazon’s PostgreSQL databases were faster and cheaper than Azure’s PostgreSQL databases. Redshift was faster and cheaper than Synapse. And Microsoft’s Azure-based SQL Server was by far the least performant of all.
- Snowflake beats them both: The results for Snowflake were remarkably good. Not only was Snowflake significantly faster than the competition at every scale, its active-use-only pricing structure yields very low total monthly costs.
- Columnar beats traditional: Across the board, columnar databases outperformed their traditional counterparts in speed, even though in some respects, as described above, the test didn’t play to their ostensible strengths. They have a higher entry price point, so they might be overkill on small datasets. On larger datasets, where performance starts becoming a problem for traditional databases, the columnar options can be both faster and cheaper.
- Scaling has its limits: Scaling up a database tends to suffer from diminishing marginal returns. The Aurora test, for example, showed that you can spend 12 times as much for less than twice the performance benefit.
Pricing information
All cost estimates were based on publicly available pricing information, accessed July 14, 2021.
- Amazon RDS: https://aws.amazon.com/rds/postgresql/pricing/
- Amazon Aurora: https://aws.amazon.com/rds/aurora/pricing/
- Amazon Redshift: https://calculator.aws/#/createCalculator/Redshift?nc2=pr
- All Azure DBMS: https://azure.microsoft.com/en-us/pricing/calculator/
- Snowflake: https://www.snowflake.com/pricing/; https://www.snowflake.com/blog/how-usage-based-pricing-delivers-a-budget-friendly-cloud-data-warehouse/
To download a copy of this report as a PDF, click the link below.
