

Ursa Health Blog
Visit Ursa Health's blog to gain healthcare data analytics insights or to get to know us a little better. Read more ...
Categories
In improvement work, tracking performance over time is a core idea. However, it’s often quite hard, technically, to work with “dynamic” data — data that reflects the changing state of the world over time.
Here, we examine some of the complexity involved in this important work, plus share approaches for working through it.
The challenge
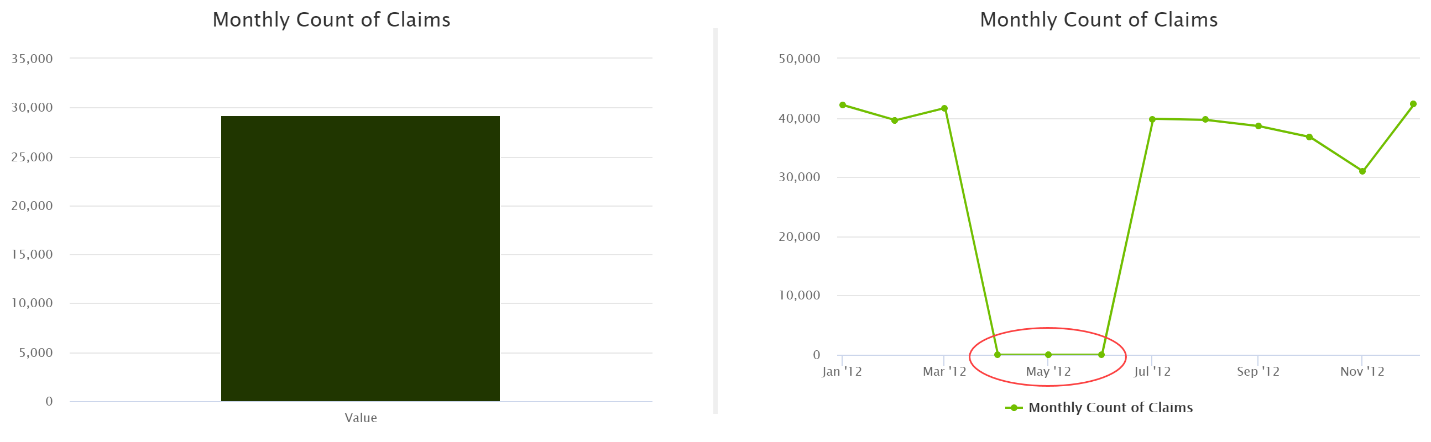
In all sorts of domains, looking at data over time is important to identify patterns that are hidden in aggregate values: for example, data diagnostics.
Technically, analytics based on “events” — concepts that have an inherent position in time (e.g., an admission)—are relatively straightforward. However, analytics based on “entities”—concepts that cannot be placed at a single moment in time (e.g., patients), and whose features can change over time—are often more complicated.
Imagine that you want to analyze the effectiveness of the care that an attributed specialist provides. Your desired outcome measure is the population rate of emergency room visits among patients with chronic disease X. The denominator observations in this case are patient-periods in which the patient *during that period* meets the inclusion criteria for disease X. The patient’s status with respect to this condition could change on any day, and you would need to know that status with fairly high resolution to assign emergency room visits accurately to those periods. Similarly, patients might change specialists at any time, so you’d need to track and potentially update that information over time as well.
This is technically challenging. It's also a very common need, especially in population health analytics.
The solution
“Timelines” are data structures that are very useful for these kinds of exercises. A timeline gives you that dynamic, historically accurate picture of an entity, usually a patient, over time. In database terms, it’s a table with a grain of one row per patient-period, with the additional property that these periods must be non-overlapping. In other words, there is at most a single, unambiguous state of the entity on any given date.
For example, consider the following hypothetical scenario:
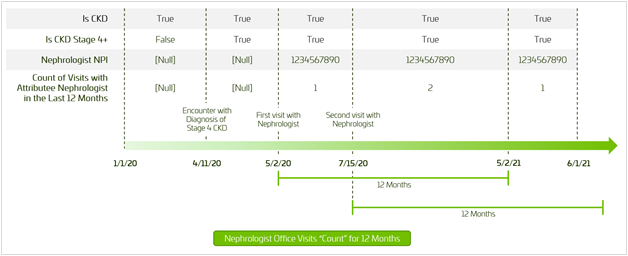
A patient starts the analysis period on 1/1/2020 already meeting the clinical criteria for chronic kidney disease (CKD) but without evidence of stage 4 or higher CKD and without a regular nephrologist to whom she is attributed. The patient goes on to have some sort of encounter on 4/11/2020 resulting in a diagnosis of stage 4 CKD and a referral to a nephrologist (NPI 1234567890), who she sees on 5/2/2020 and again on 7/15/2020. There are no further visits in the analysis period, which ends on 6/1/2021.
The following table represents the timeline treatment of this scenario, tracking some dynamic patient features:
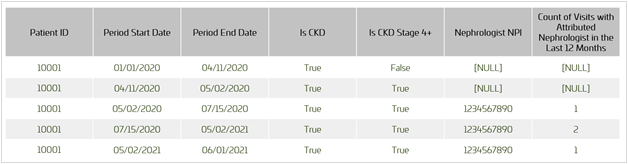
Armed with this data structure, an analyst can quite easily generate dynamic results such as the population rate per 1,000 patient-years of emergency department visits among patients with CKD stage 4 or higher. For that analysis, we would consider the second to fifth rows of the table above to be a qualifying denominator observation (“Is CKD Stage 4 or Higher” equals 1), contributing some small number of thousands of patient-years based on the elapsed time represented by those records (i.e., the period 4/11/2020 to 6/1/2021). Any emergency room visits that happened during that period would be counted in the numerator.
Consider in the above example that the criteria for “full” attribution to a nephrologist might require two or more visits in the prior 12 months, meaning the timeline would have to handle scenarios in which patients both enter and exit relationships with a nephrologist over time. (In the above table, note that, after a sufficient time without a follow-up visit with her nephrologist, the patient’s count of visits in the last 12 months ticks down from two to one on the anniversary of her first visit.)
Typically, an analyst would perform these kinds of analyses by picking a set of “snapshot” dates on which to evaluate the patient’s status (e.g., the first of each month) and recalculating all necessary features for each date. Compared with this approach, using a timeline has two important advantages.
- First, the resolution will be better with the timeline, since patient status will be accurate to the day — not, say, the month.
- Second, database performance is often significantly better with timelines, since long periods of quiescence in a patient’s status (e.g., in the case above, the period 7/15/2020 to 5/2/2021) need only be evaluated at the start and end dates, not on each of the (10) snapshot dates covered by that period. In addition, once created, the timeline can support any periodicity (or within-period position) of snapshot dates, without needing to be regenerated.